Independent vs. Dependent Variables
Create a sentence with the word "causes" in it.
Then the independent variable "causes" the dependent variable
Example
Independent: number of players on the DL list
Dependent: length of losing streak
Levels of measurement
Nominal Categories have names but No numbers Pitchers
Catchers
Infielders
Outfielders
Ordinal Categories can be placed in an Ordered list, but do not have associated numbers
The terms "greater than" and "less than" can be applied
Freshman
Sophomore
Junior
Senior
Interval-ratio Categories have equal numeric intervals
Ratio: One category begins at zero
GPA 2.51 - 3.00
GPA 3.01 - 3.50
GPA 3.51 - 4.00
Reference
Types of statistics
Descriptive Statistics Univariate Describes one variable at a time Average ERA of Red Sox pitchers
Bivariate Describes the association between 2 variables Average ERA of pitchers by team
Inferential Statistics Determine if the statistics from a sample IN a larger population confidently describe the statistics of the larger population
Reference
Proportion, percentage, ratio, rate
These all have to do with comparing parts of something either to the whole thing or to each other
How big a part of the whole is something? ProportionNumber of observations in one category ÷
Number of observations in all categories
Always a number BETWEEN 0 AND 1
PercentageNumber of observations in one category ÷
Number of observations in all categories x 100
Always a number BETWEEN 0 AND 100
You can convert between proportion and percentage by multiplying (or dividing) by 100
Crude Rate
Rate
Number of actual occurrences of a phenomenon ÷
Number of possible occurrences of a phenomenon
in some unit of time
Always a number BETWEEN 0 AND 1
Rates are often expressed as powers of 10 to eliminate decimal points. To do this, just multiply the crude rate by the power. For example, a crude rate of 0.526 is the same as 526 (0.526 x 1000) per thousand
How do two things compare to each other? Ratio Number of observations in one category ÷
Number of observations in another category
Always a number GREATER THAN 0
Ratios are often expressed as powers of 10 to eliminate decimal points. To do this, just multiply the ratio result by the power. For example, a ratio of 0.873 is the same as 873 (0.873 x 1000) per thousand
The Normal Curve
If you begin collecting data on a variable that is continuous, such as heights, weights, temperatures, etc., if you take enough samples (collect enough data points), the population will usually be described by the Normal Distribution. That can be proven by something called the Central Limit Theorem, but the proof is a mathematical exercise best left to math geeks.
The Normal Curve is a function plotted in xy coordinates. The actual equation is complex and not necessary to learn. The key features of the normal distribution are as follows:
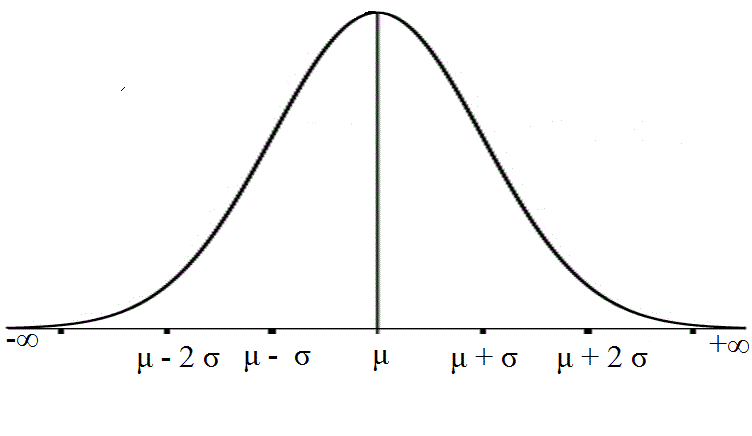
  • It has the shape of a "bell" curve
  • The curve is horizontally symmetric (the left half will match the right if folded over)
  • The tails of the curve extend indefinitely and never actually touch the X axis
  • The midpoint of the curve is the same as the arithmetic mean of the sample and is designated by μ (mu)
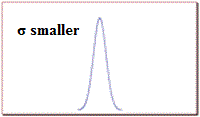
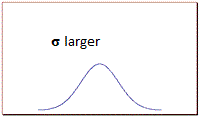
  • A value named σ (sigma) is the same as the standard deviation of the sample. When σ is large, the curve is short and wide; when σ is small, the curve is tall and narrow.
The Normal Distribution is a continuous probability density function defined by the area under a portion of the Normal Curve. The total area under the curve is always 1, no matter what μ and σ are The thing that is important about the Normal Curve is not the value of any point on it. What is important is the area (distribution) under various portions of it.
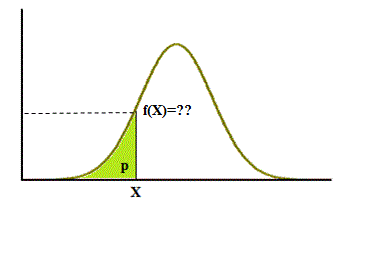
Some of the kinds of questions you can use the Normal Distribution to answer are as follows (use the above diagram):
  • What is the probability that some value, A, is greater than X? (X < A < +∞)
  • What is the probability that some value, A, is less than X? (-∞ > A < X)
Areas under the normal curve
About 68% of the area under the curve falls within 1 standard deviation of the mean.
About 95% of the area under the curve falls within 2 standard deviations of the mean.
About 99.7% of the area under the curve falls within 3 standard deviations of the mean.
Summary:
(the 68 - 95 - 99.7 rule)
How to use the normal distribution
Most problems using the normal distribution involve matching up and combining "slices" of area with the number of standard deviations of the mean. The mean (μ) and standard deviation (σ) are usually provided. Here's a diagram of the most important slices:

Using the above diagram, if the average (μ) of Major League pitchers' ERA's is and the standard deviation (σ) is , then:
  • 50% of pitchers had an ERA less than
  • If a pitcher is selected at random, the chance his ERA is greater than is 50%
  • 34% of pitchers had an ERA between (μ - 1σ) and (μ)
  • If a pitcher is selected at random, the chance his ERA is between (μ) and (μ + 1σ) is 34%
The following numbers are important to recognize in a problem:
2.5%-∞ to μ - 2σμ + 2σ to +∞
5%-∞ to μ - 2σ
AND
μ + 2σ to +∞
13.5%μ - 2σ to μ - 1σμ + 1σ to μ + 2σ
16%-∞ to μ - 1σμ + 1σ to +∞
32%-∞ to μ - 1σ
AND
μ + 1σ to +∞
34%μ - 1σ to μμ to μ + 1σ
47.5%μ - 2σ to μμ to μ + 2σ
50%-∞ to μμ to +∞
68%μ - 1σ to μ + 1σ
84%-∞ to μ + 1σμ - 1σ to +∞
95%μ - 2σ to μ + 2σ
97.5%-∞ to μ + 2σμ - 2σ to +∞
Problems using the normal distribution